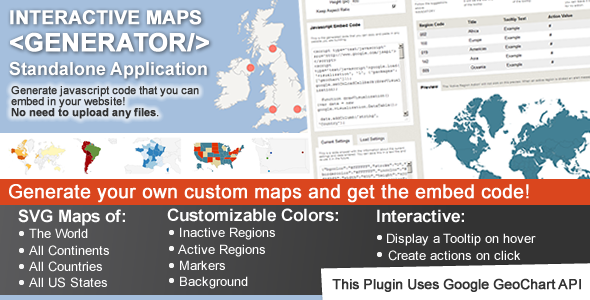
Interactive Maps Generator is a standalone browser-based application that produces embeddable, clickable maps for websites. Users pick a region — the world, a continent, a country, a US state, or a country broken down by its own provinces — colour the areas they care about or drop markers on them, then copy a short embed snippet into any page that accepts JavaScript. It suits freelancers, agencies and site owners who need a geographic visual without installing a mapping plugin or maintaining a server-side stack.
Sold on CodeCanyon under the JavaScript > Media category, the script is priced at $24.00 and has accumulated 2,949 sales with a 4.44 out of 5 rating from 61 reviews. It is developed by cmoreira, who also maintains a WordPress-specific edition of the same tool. The version reviewed here is the framework-agnostic build, and the vendor last updated it in June 2020.
What the Generator Actually Lets You Build
The core workflow is a map builder rather than a code library. A user selects a geographic scope, applies styling, defines which regions are active, and exports an embed code. No files need to be uploaded to the destination site, which removes an entire class of deployment problems for people who do not have FTP or file manager access.
Geographic coverage is the product’s strongest selling point. The vendor states that virtually every country in the world is included, along with continents, sub-continents such as Western Europe or South America, individual US states, and US states subdivided by metropolitan area. Countries can also be rendered with their internal administrative divisions — French regions, German states, Brazilian states and similar — which is the level of detail most regional sales or distribution pages actually need.
Active areas can be displayed in two modes. Region mode fills the entire shape with colour, which works well for choropleth-style visualisations where the whole territory is the unit of interest. Marker mode places a coloured bubble at a point, which suits city-level or single-location data on a country or world map. Both modes coexist in the same map, so a world view can highlight whole countries while pinning individual offices.
Interactivity is handled through tooltips and click actions. A tooltip appears on hover and displays whatever text the author supplies. Clicking an active area can open a URL in a new tab, display an inline message, or trigger a custom JavaScript function that the site owner writes. That last option is the escape hatch: anything the built-in action types cannot do can be scripted, provided the person writing the code knows JavaScript.
Visual customisation covers background colour, border width and colour, the fill used for inactive regions, per-region colours for active areas, marker size, and the map’s width and height. The vendor notes that CSS-savvy users can attach custom classes and extend the styling further — hover effects, cursor changes and similar — because the output is standard markup rather than a canvas.
Rendering uses the Google Geochart API to produce SVG vector maps. SVG means the shapes are drawn from geometry rather than raster images, so they stay sharp at any size and do not require Flash. That last point matters for anyone still supporting older desktop environments, and the vendor lists compatibility with IE9 through IE11 alongside Firefox, Safari and Chrome.
Where This Fits and Where It Does Not
The clearest fit is a site built on a platform that makes plugin installation awkward but allows raw JavaScript in a content block. Wix, Squarespace and Joomla are named by the vendor as compatible, and the same logic applies to any CMS with a custom HTML or embed element. A marketing page listing regional distributors, a travel site showing destinations, a franchise locator, or a nonprofit tracking programme coverage can all be assembled in an afternoon without touching a server.
Agencies building several client sites benefit from the multi-map model. The application is standalone, so one licence can generate an unlimited number of maps, each with its own embed code. That is a different cost structure from per-site mapping subscriptions and is worth weighing for anyone maintaining a portfolio of small clients.
It is the wrong choice when the map needs to reflect live or frequently changing data. There is no database connection, no CSV import and no API feed described in the vendor material. Updating a region means returning to the generator, editing the map by hand and replacing the embed code on the site. For a page with twenty locations that change weekly, that manual loop becomes the dominant cost.
It is also a poor fit for dense data visualisation. There is no heatmap mode, no graduated colour scale driven by numeric values, and no legend generator in the documented feature set. Anyone who needs to show magnitude rather than presence should look at a charting or GIS library instead.
Strengths and Limitations
Strengths
- Embed-only deployment means no file uploads, no server configuration and no dependency on the host’s file permissions.
- Geographic coverage spans world, continent, sub-continent, country, country-with-regions, US state and US metropolitan area breakdowns.
- Unlimited maps from a single purchase, which suits agencies and multi-brand operators.
- SVG output stays crisp at any size and avoids Flash entirely, so it renders on Mac hardware and modern browsers alike.
- Custom JavaScript actions give developers a route past the built-in click behaviours.
- Established sales history: 2,949 purchases and a 4.44 rating across 61 reviews is a meaningful signal that the tool works as described for most buyers.
Limitations
- The last vendor update was June 2020. Buyers should verify that the current Google Geochart API behaviour still matches the script before committing, since third-party API changes are the usual failure mode for tools of this kind.
- Responsiveness is partial by the vendor’s own description. The map fills its container on load and adapts to phone, tablet and laptop widths, but it does not reflow if the browser window is resized afterwards. Rotating a tablet or dragging a desktop window will leave the map at its original dimensions.
- All content is manual. There is no data import, no content management system integration and no way to drive region colours from an external source.
- Dependence on Google’s Geochart API means an external service sits between the site and its own map. If that endpoint changes or is rate-limited, the map is affected.
- Internet Explorer 9 through 11 support is listed, but those browsers are long past end of life; the practical compatibility surface today is modern evergreen browsers.
- No legend, no numeric colour scale and no heatmap rendering are documented, which limits the tool to presence-and-location storytelling rather than quantitative analysis.
How It Compares to the Wider Category
Three broad alternatives exist. The first is a full mapping plugin tied to a specific platform, typically a WordPress plugin with a database-backed location manager. Those offer admin interfaces, search filters and bulk imports, but they lock the map to one CMS and usually carry a recurring licence. Interactive Maps Generator trades that depth for portability — the same embed code works on any platform that accepts JavaScript.
The second alternative is a general-purpose JavaScript mapping library such as Leaflet or the Google Maps JavaScript API used directly. These are free and far more capable, supporting tiles, zoom, panning, markers clusters and live data. The trade-off is development time: building a clickable country map with tooltips and per-region styling from a raw library is a day or more of work, and the result still needs testing across browsers. At $24.00, the generator is essentially a shortcut past that build.
The third alternative is a hosted visualisation service that generates embeddable charts and maps from uploaded spreadsheets. Those handle data updates gracefully but introduce a subscription and often a visible watermark on lower tiers.
Against all three, the generator’s position is narrow but coherent: fast, cheap, portable, and best for static geographic storytelling rather than live data or deep analysis.
Frequently Asked Questions
Do I need to install anything on my website to use Interactive Maps Generator?
No. The tool runs as a standalone application and produces an embed code that is pasted into a page. Nothing is uploaded to the destination server, so no FTP access or file permissions are required. The only requirement is that the platform allows JavaScript inside a content block, which covers Wix, Squarespace, Joomla and most CMS platforms with a custom HTML element.
Can the maps show live data from a database or spreadsheet?
No. Every region colour, marker and tooltip is entered manually inside the generator, and the resulting embed code is static. There is no documented import from CSV, database or API. Updating the map means returning to the generator, editing it and replacing the embed code on the site, which makes the tool unsuitable for frequently changing location data.
Is the map responsive on mobile devices?
Partly. If no fixed width is set, the map loads at the full width of its container, so it adapts to phones, tablets and laptops at the moment of loading. It does not, however, resize after loading, so rotating a device or resizing a desktop window leaves the map at its original dimensions until the page is refreshed.
What happens if I need a click behaviour the tool does not offer?
Custom JavaScript functions can be attached to active regions. The built-in options cover opening a URL in a new tab and displaying an inline message, but users comfortable writing code can define their own function for a click event. That makes the tool extensible beyond its default actions, provided someone on the project can write and test JavaScript.
Verdict
Interactive Maps Generator earns its place for site owners, freelancers and small agencies who need a clickable regional map on a platform that resists plugins, and who are happy to update content by hand. The embed-only model, broad geographic coverage and unlimited map generation justify the $24.00 price for that audience, and nearly three thousand sales with a 4.44 rating suggest it delivers on its promises.
It is not the right purchase for anyone whose map must reflect live data, display quantitative values through a colour scale, or update without editing embed code. The partial responsiveness and the 2020 last-update date are genuine caveats worth checking against the current demo before buying. Buyers who need a maintained, data-driven mapping stack should look elsewhere; buyers who need a static, portable, good-looking regional map will find this fits.